This Is What Science Looks Like at NC State: Emily Griffiths
Editor’s note: This post was written by Emily Griffiths, a postdoctoral researcher in NC State’s Department of Entomology. She also writes Emily’s Dengue Blog. This post is an entry in an ongoing series that we hope will highlight the diversity of researchers in science, technology, engineering and mathematics. The series is inspired by the This Is What A Scientist Looks Like site.
Hi! I’m Emily Griffiths and I do research in a group led by Fred Gould and Alun Lloyd at NC State using computational techniques to answer questions about the spread of disease. I’ve gone on a bit of a circuitous journey in my career so instead of chronologically retelling how I came to work here let’s jump inside my head and explore how I think.
I am fascinated by how we describe the living world, especially in relation to disease. Often we pick out average patterns. For example, there is a one in 10 chance of being susceptible to seasonal flu each winter. But for most people these statistics are bogus. People differ, and often there are patterns to these differences. For example, frequent flyers will be more likely to come into contact with droplets of flu virus than a hermit who never leaves home.
Then again, some of these personal characteristics will cluster together to perhaps reduce the severity of disease even if you did contract the flu. Those people at the airport, for instance, are probably relatively wealthy and healthy.
In some cities in the UK (where I grew up), people living in a wealthy neighborhood can live 12 years longer than those living in a poor area on other side of town. Appreciating how people vary around an average is important, but when I try to place myself in that kind of life expectancy statistic we begin to see how it breaks down: I no longer live in the UK, and even when I did live there I lived in many different places. Yet death statistics only record where someone was living when they died. If I picked up the flu on a trip back to the UK, but died in the US, the CDC would include me in their statistics and I would be absent from the British database. Capturing where people have been is really complicated, and a real challenge for those studying health outcomes.
I spend a lot of my time thinking about which characteristics are important to health, especially those characteristics that help distinguish individuals with high risk of disease from mosquitoes. This is even more tricky than flu because we have people moving around transmitting disease, and mosquitoes buzzing around biting them. So we not only have to track the movement of the people, we have to track the movement of the mosquitoes.
Right now I’m building a computational model that can simulate all the people and mosquitoes in a city over multiple years in order to track, and ultimately predict, the spread of dengue. I include things that have been studied before, like the age at which people get infected with dengue, how long dengue infection lasts, or how often mosquitoes of a specific species suck blood. I try to include information on how these aspects of disease vary from person to person, or from mosquito species to mosquito species. A lot of scientists are working on studying these things in more detail so that we can make better predictions of how many people might get sick.
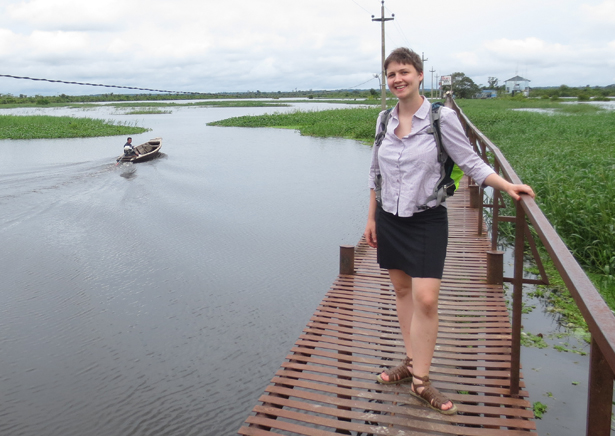
There are probably other differences that might also be important, but for whatever reason (logistical, political, financial) remain unstudied. Above is a picture of me on fieldwork in Iquitos, Peru, which is an Amazonian city where a lot of impressive disease research is being done. The bridge I’m standing on crosses a river that separates two neighborhoods during half the year. The other half of the year the river subsides and people can walk across the sand.
I wonder what difference river inundation makes for disease risk: in the low season people might walk more between neighborhoods and spread more disease, but in the high season people are less well connected and might eat more fish that may boost their immune systems. Maybe you can come up with other ideas. I am not aware that these seasonal differences have been investigated much in riverine settlements, but it might be interesting at some point to use my model to test the implications of seasonal changes in river level for mosquito-borne disease.
Thinking of members of the transnational community (like me) poses another challenge.
A lot of effort is being put into surveying how citizens in Iquitos live, and how often they get diseases from mosquitoes. But it is a lot harder to survey groups of foreign nationals who might come and live in a city having never encountered local diseases before, or who might bringing new diseases in from overseas. These expats are by nature a transient group who come and go. They might have complicated travel and medical histories, and might not be the target of local health interventions anyway. So when I am building my model I have to assume either that these people act like locals, or that they differ in some way.
As you can see I’m always questioning things! It’s vital that we approach disease models with this kind of critical thinking, especially when the outcomes of models can inform health policies. One key advantage of simulation models is that once we have thought about the issues we can use the model to test what difference including or excluding a new feature might make to disease estimates. Integrating uncertainty into the evidence base is the main motivation behind my work. I want take both what we know and what we don’t know to inform decisions about public health.
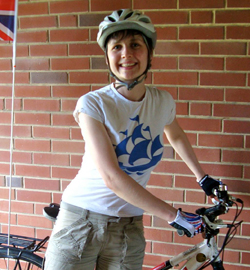
Thanks for reading! Now I’m off for a cycle ride, maybe I’ll see you on the roads or trails sometime.
- Categories: