Harnessing Crowds to Analyze Clouds

When it comes to analyzing hurricanes and other tropical cyclones, lack of data isn’t the problem. Scientists have 30 years’ worth of satellite images of these massive storms. However, what they don’t have is reliable data about cyclone intensity, because analysis methods have changed through time and from one region to another. And that’s a problem when you’re trying to predict how climate change may affect the strength and frequency of these storms.
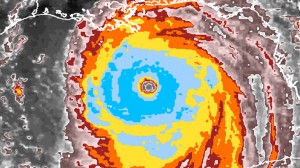
One of the best methods for determining cyclonic intensity remains good old-fashioned human observation and classification of images. But the volume of data is daunting, especially when each image needs to be analyzed by several different people for consistency. Researchers from NC State’s Cooperative Institute for Climate and Satellites – North Carolina (CICS-NC) have come up with an innovative solution to the problem: recruit and train citizen scientists to analyze the images online.
CycloneCenter.org launched in 2012, with a backlog of 200,000 satellite images of cyclones that needed analysis. The website, a collaboration between CICS-NC, the University of North Carolina at Asheville, NOAA and the Citizen Science Alliance, recruited volunteers online and trained them on how to classify the images they were seeing. In a recently published paper in the Bulletin of the American Meteorological Society, the Cyclone Center gave the preliminary results from its first two years.
According to Carl Schreck, CICS-NC research associate, the response has been pretty good. “We’ve had about 350,000 classifications in two years,” Schreck says. “We want each of our 200,000 images to be classified by 10 different volunteers, in order to reduce uncertainty or error.”
Uncertainty is an issue, and the Cyclone Center team has done its best to quantify and eliminate the variable as much as possible. Classifications are weighted according to the degree of consistency among volunteers. So far, the results are encouraging.
“Beyond simply helping us classify and catalog these storms, we’ve also demonstrated that you can get people with nonscientific backgrounds involved in scientific research, with positive results,” Schreck says. “And it serves an educational purpose for the public as well.
“Going forward we’ll take a more focused approach to the storms and look at a year’s worth at a time, to get a more complete picture. Getting a snapshot for a single year around the globe will teach us about the differences between storms in various regions.”
Interested in volunteering? Go to CycloneCenter.org and start classifying.
- Categories:


