How 21st Century Tech Can Shed Light on 19th Century Newspapers

The 19th century saw something of an explosion in periodicals. For example, the number of newspapers in Britain alone leapt from 550 in 1846 to more than 2,400 just 60 years later. For humanities scholars, tracking information in such a huge mass of publications poses a daunting challenge.
Digital humanities efforts have made some headway in creating tools that allow scholars to search across all of that text. But the challenge becomes significantly more complex when trying to make sense of the thousands of images also found in newspapers of the period.
This is where Paul Fyfe and Qian Ge come in. Fyfe is an associate professor of English at NC State, where Qian Ge is a Ph.D. student in electrical and computer engineering. Together, they have done some exploratory work on how computer vision might be used in the context of analyzing 19th century newspapers.
A paper describing their findings, “Image Analytics and the Nineteenth-Century Illustrated Newspaper,” was published in October in the Journal of Cultural Analytics.
We recently had the chance to pick Fyfe’s brain to learn more about what this unlikely duo learned while attempting to analyze more than 140,000 images from three period newspapers.
The Abstract: What research questions or challenges were you setting out to address with this project?
Paul Fyfe: Our first question was pretty simple: could you even use computer vision approaches to analyze these historical materials? As we discovered, many image analytics tools are intended for photographs. This makes sense, as digital images have proliferated. But the majority of our materials are not photographs. They are engravings made from carved lines and hatches. Can a computer recognize and sort this stuff? And if so, how?
Our next question had more to do with digital humanities research. Generally speaking, lots of “big data” approaches to historical materials have focused on text. But, as the historian Liz Lorang asks, “What can we do with the millions of images that represent the digitized cultural record?”
Our last question was about the 19th century when, arguably for the first time, millions of images were circulating thanks to illustrated newspapers. What kinds of visual patterns could we find in these illustrations? What things were people seeing? How did the relative amount of text and image on the newspaper page change over time?
TA: What was novel about your approach to the material in addressing these questions?
Fyfe: To date, most large-scale digital humanities research projects have focused on text. Our project is part of a wave of new research on visual materials at scale. It is also novel in trying to use computer vision techniques not simply on photographic images, but historical engravings.
Computational research is very novel in my own field of 19th century book and media history. We’re not trying to closely analyze a single illustration and its meaning, but studying thousands at a time. It’s a different approach to understanding how texts, newspapers and images work on a larger scale than a single reader. Not that it’s a better approach, of course, but perhaps a complimentary approach to what humanities researchers are already good at doing.
Finally, it was a novel collaboration between the Departments of English and Electrical and Computer Engineering. Largely facilitated by the activities of NC State’s Visual Narrative cluster.
TA: What do you think are the key findings that stem from the work?
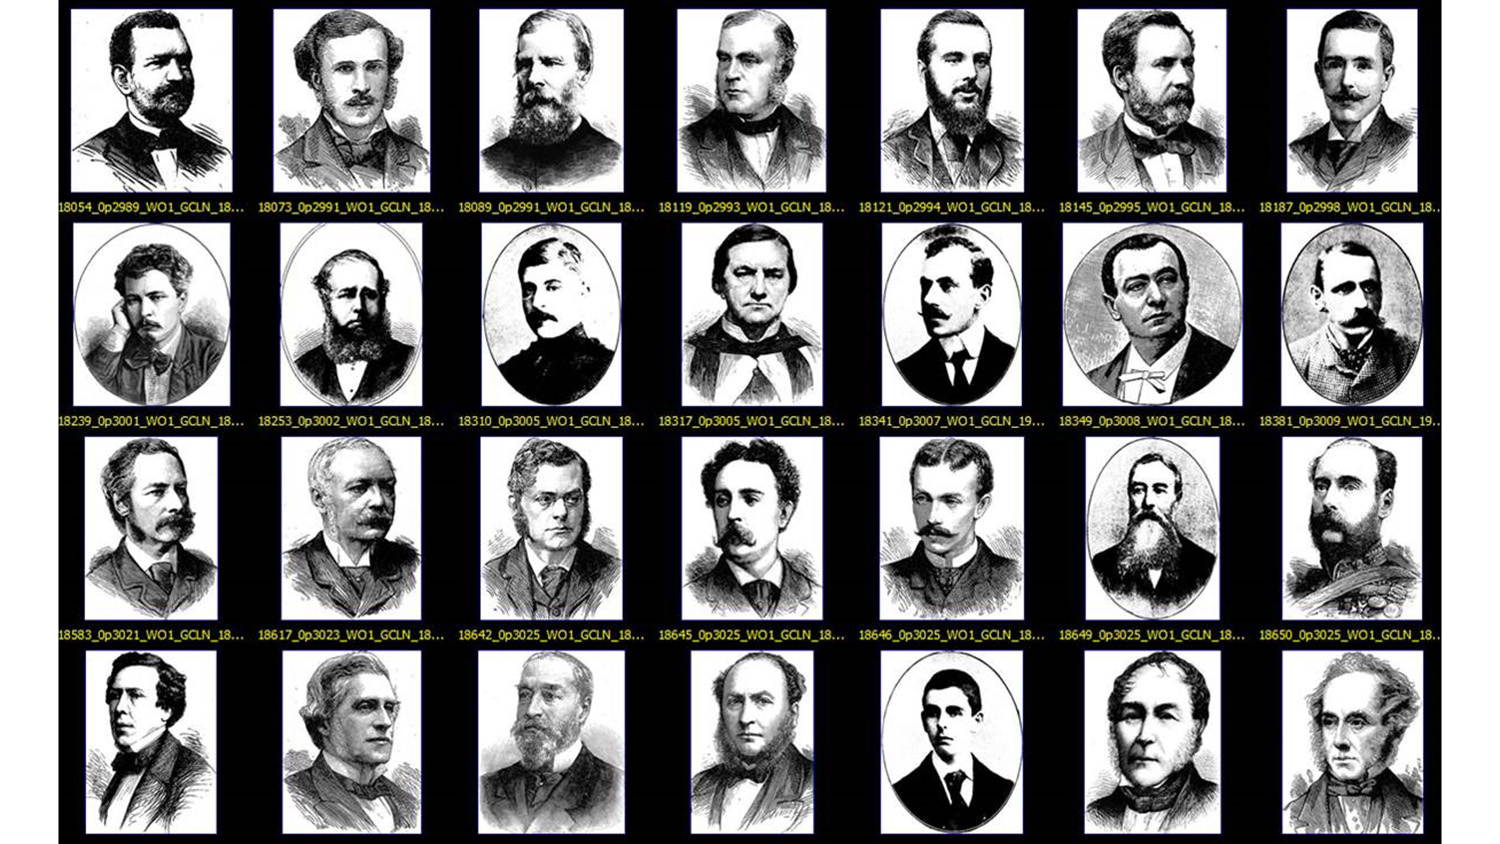
Fyfe: We found a lot of clusters of related images that haven’t been studied before as a group. For example, loads of illustrations of crimes at night; dozens of international maps published by a newspaper known for its art reproductions; thousands of portraits formatted in the same way. These clusters make us think about the patterns of visual knowledge as the press became a multimedia experience.
We also found patterns in how illustrated newspapers presented images over time. For instance, the increasing number of halftone photographs relative to wood engravings; the gradual blending of text and images on a single page, as opposed to pages strictly containing one or the other.
Finally, it’s important to note what we couldn’t find. Our techniques, at least, were not able to identify the contents of images. We had to sort them by low-level measurements of their pixels instead of by subject matter. Additionally, while we worked with thousands of illustrations, those images still offer only a fairly narrow representation of the 19th century’s visual culture. Even working at a large scale, we know we have to qualify what – and more importantly who – our data set represents or excludes.
TA: How could these findings inform future work in the field?
Fyfe: I think it shows other humanities scholars the potential of looking at much larger collections of materials than we’re used to. People might have to broaden the scale of their arguments about what a historical illustration means or how it functions. And I hope it encourages others to try out more computer vision approaches to these materials, or at least to pursue new kinds of interdisciplinary collaboration.
- Categories:


