Crowdsourcing New Range Data for North American Mammals
Researchers found that North American mammals are inhabiting new areas — and doing so more frequently than scientists can record these shifts in official maps. Can a crowdsourced biodiversity platform offer a solution?

To understand biodiversity, ecologists examine the range patterns of animals — areas representing where they live, potential habitats suitable for them and locations they could migrate to. Historically, professional field experts document this information in comprehensive maps.
However, in an era of global change — and animals adapting to rising temperatures — scientists are beginning to adjust which maps they use.
At NC State University, researchers are exploring the shifting ranges of North American mammals, aided by biodiversity databases largely comprised of photographs captured on the devices most of us carry every day. They are also assisted by another crucial resource: human curiosity and the passion to document and better understand our planet’s myriad plant and animal species.
Crowdsourcing Biodiversity
To understand and track how animals respond to global changes, researchers need accurate and timely estimates of species distributions.
Typically, ecologists rely on range maps created by the International Union for Conservation of Nature (IUCN) and its commissions of scientists and experts. These maps illustrate suitable habitats and where animal species are likely to occur — but they risk representing too broad an area.


Additionally, the IUCN typically updates its range maps every eight years; however, tracking how animals are responding to global changes may require more frequent updates.
For these reasons, Alex J. Jensen, an NC State ecologist and research scholar who’s a postdoctoral fellow at the North Carolina Museum of Natural Sciences’ Biodiversity Lab, is utilizing a large-scale citizen science data platform called iNaturalist to better understand the range expansion of 94 North American mammals.
iNaturalist is a crowd-sourced online database of biodiversity information, created by a community of scientists, amateur naturalists or anyone else passionate about identifying animal and plant species. As a citizen science tool, the online platform harnesses public involvement in the gathering, analyzing and sorting of scientific data for research purposes.
Users of iNaturalist create observations by sharing photos, often taken on smartphones, and documenting time and location data. The app relies on its users’ goodwill and genuine curiosity to share and discuss findings, regardless of whether they’re a degree-holding scientist, a seasoned researcher or a passionate hobbyist.
For scientists to use an observation, it must be classified as research grade, which means that two-thirds of the users weighing in must agree on the species’ identification.
“It’s this new kind of data that’s online and has been vetted by a community that scientists can use,” said Jensen, the lead author of the recently published paper, Mammals on the Margins: Identifying the Drivers and Limitations of Range Expansion.
Using iNaturalist, Jensen’s team examined over 60,000 observations to understand which ones represented extra-range shifts, or in other words, where species had potentially established a new range outside of the IUCN range maps.
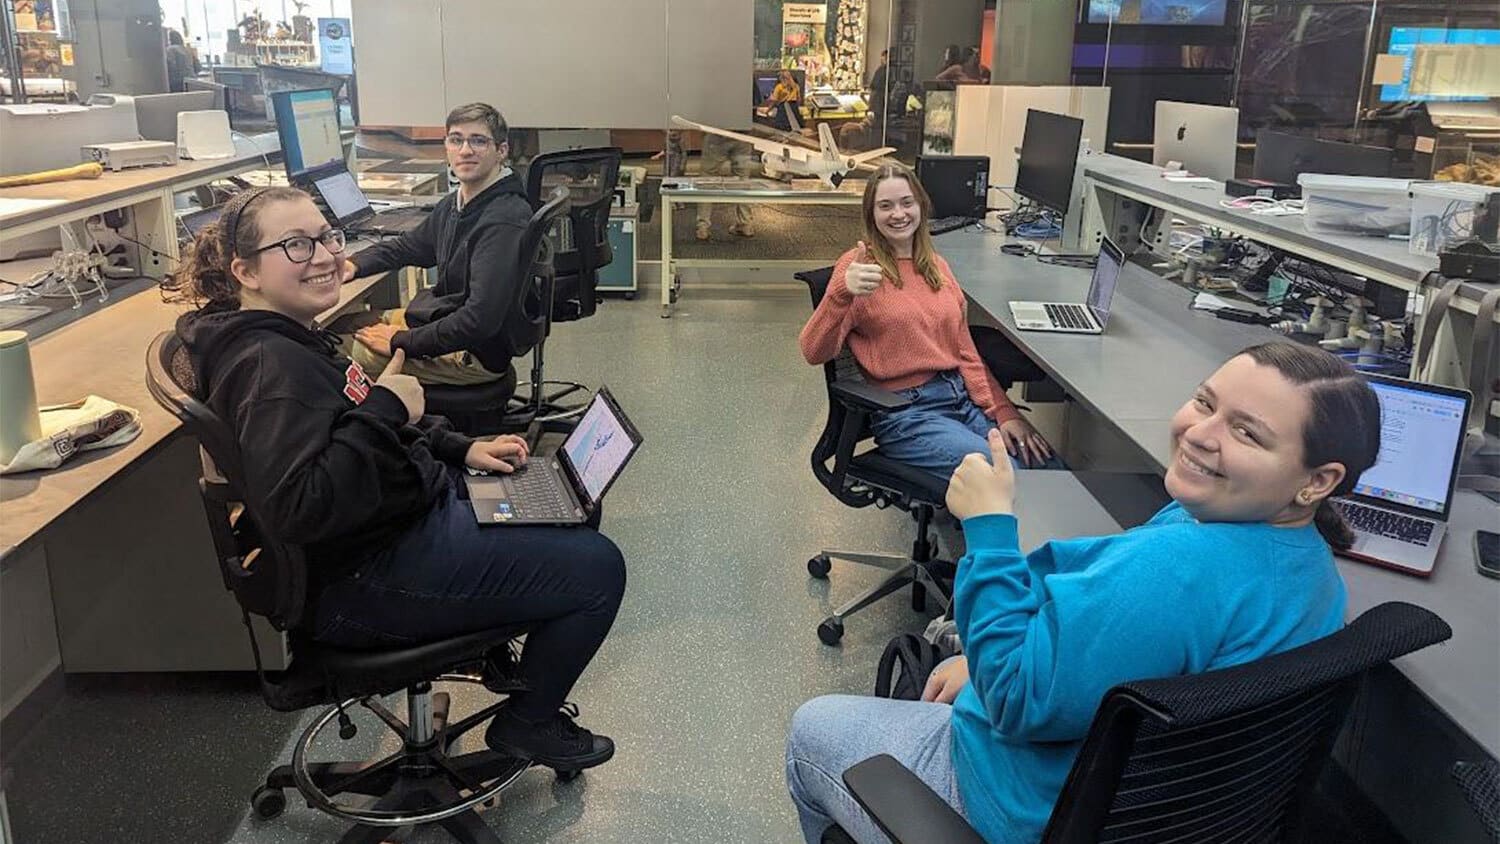
The team included four undergrads in NC State’s Environmental Sciences program, whom Jensen mentored and trained to identify a handful of species each. Once a week, the students analyzed observations on iNaturalist, focusing on clusters of green dots that represented a concentration of a specific species. They also learned data curation and how to use project-specific criteria to vet observations on iNaturalist, ensuring they were reliable.
“So we would say, ‘Okay, let’s look at this cluster. Are there really black bears there? Are those legit?’” Jensen explained. “If it’s an animal track, we don’t trust that necessarily; that could be misidentified as a different species. But if it’s a picture of a black bear, and you trust it, then we’ll say that it’s trustworthy.”
The research team excluded iNaturalist entries of scat or bones because they’re difficult for reliably identifying species. They also avoided species that were challenging to see clearly in photos, such as nocturnal animals and small rodents.
The research team found that 98% of the close to 60,000 observations were accurate.
The research team found that 98% of the close to 60,000 observations were trustworthy. Jensen’s study argues that citizen science data is a valuable tool for conservation by tracking how organisms respond, or fail to respond, to global change.
“One of the big-picture takeaways from this was that a lot of this data is trustworthy, and we should probably be using it more than we already are,” Jensen said.
iNaturalist currently holds close to 260 million observational photos of nearly 520,000 species of plants, animals, fungi and other life forms.
“The more up-to-date maps are always going to be the ones created by more people. And yeah, that’s crowdsourcing that information,” said Caren Cooper, a professor in the Department of Forestry and Environmental Resources.
An expert on and advocate for citizen science, she believes that crowdsourced biodiversity platforms, such as iNaturalist, make important contributions to work like Jensen’s, thanks to the sheer number of people involved in gathering and recording observations. And while digital applications are relatively new, scientists and researchers have long relied on forms of participatory science to understand phenomena that are widespread or occurring over time.
“When we bring a big data set like that together, it reveals patterns and things that no one would be able to find working alone,” Cooper said. “The power of citizen science observations is that there are just more eyes, phones or photographs out there.”

Using iNaturalist, combined with range maps, Jensen’s team was able to track the expansion of North American mammals’ ranges with greater accuracy in time and location — suggesting that integrating citizen science data would improve IUCN data.
Indeed, the use of such data seems inevitable with the ubiquity of smartphones and the ability to quickly and easily share information to create electronic databases.
“There’s just so much more citizen science data. It’s not just for mammals. It’s for birds and insects, and plants,” Jensen said. “It has sort of exploded, and it’s part of this revolution that we call digital-born data.”
New Data for Black Bears, Armadillos and Other Species

Jensen’s team found that, on average, 16% of the iNaturalist data fell outside a species’ IUCN range maps.
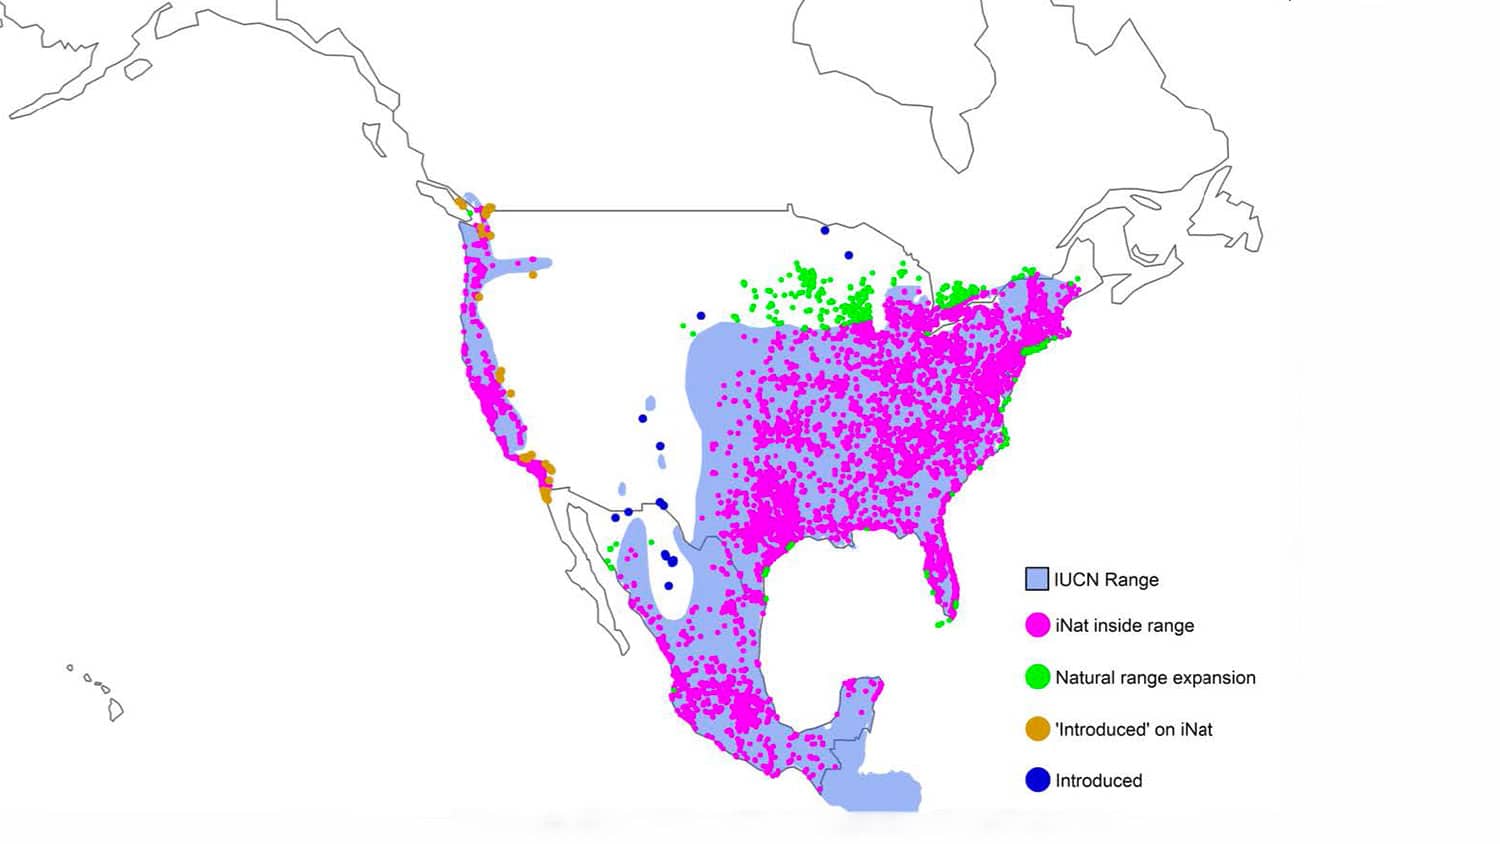
Black bears, for instance, were shown on the IUCN map to range across a large portion of Canada and through parts of the Southeast and Southwest. The research team compared this range information to the 13,500 iNaturalist observations, which revealed that black bears were expanding 11% outside of the IUCN range and deeper south, in places such as Mexico, Louisiana and Florida.

Pronghorns, meanwhile, appear to be widening their range further west of the Rocky Mountains and moving north, according to iNaturalist data. The 4,846 observations represent a 39% expansion outside of the IUCN range.
The IUCN data reports that the range of the eastern fox squirrel spans the eastern half of the United States, extending to the Rocky Mountains. The iNaturalist data, on the other hand, reveals nearly 50,000 observations in pockets of almost every state west of the Rockies, many of which were in urban areas. Like the pronghorn, the iNaturalist data expands the range by 39% outside of the IUCN range. This expansion was likely caused by introductions, or in other words, instances when humans were responsible for the arrival of a species to a new region.

For the nine-banded armadillo, the IUCN range for this species reaches from Central America to a large swath of the Southeast of the United States, from Georgia’s northeastern border into parts of the Midwest. iNaturalist observations record 4% more sightings than the IUCN range, with recent extensions into North Carolina and other southern states.
Human Impact
Jensen and his team developed a methodology to distinguish between natural range expansions and human introductions of 48 species. Their analysis also examined how factors such as temperature shifts, protected habitats and changes in the amount of land covered by forests or crops affected extra-range expansions.
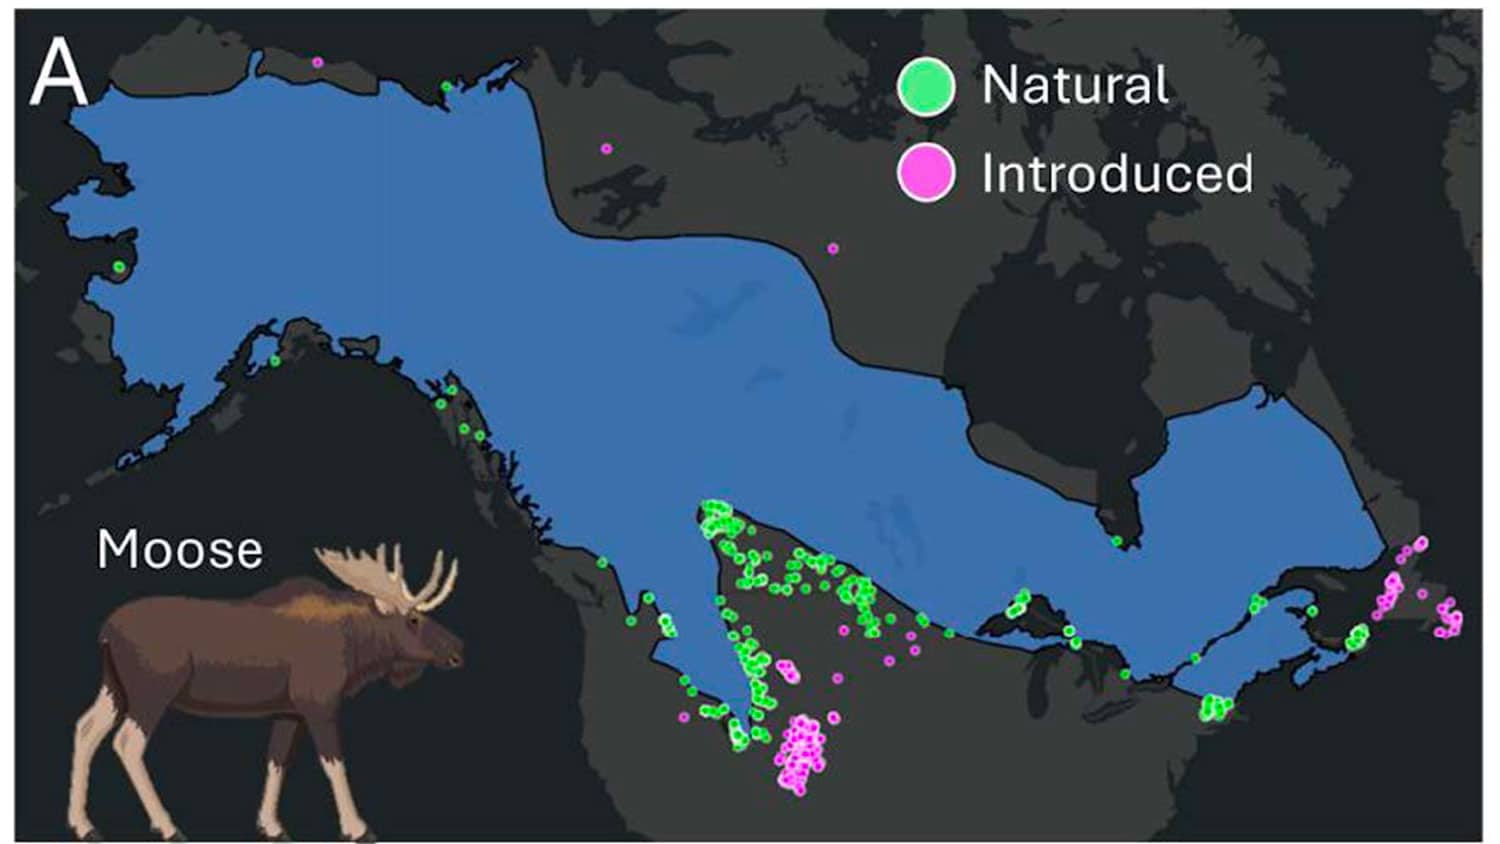
Using their methodology, they identified human introductions for 36% species. The majority of the range expansions for moose, eastern gray squirrels and American martens were due to humans bringing these species into new regions.
Contrary to what some may think, animal species don’t always shift their latitudes to areas that have warmed enough to be newly suitable. Instead, the team found substantial variation in the direction of range changes. Some North American mammals, such as three species of squirrels, have established their habitats in warmer areas.
The red fox, gray fox and white-nosed coati, on the other hand, were most affected by temperature changes, suggesting that they shifted their distributions to areas that had warmed less over time.
On the whole, the researchers found that animals seemed to expand their ranges into areas with the least human footprint — a term that encompasses factors such as population density, land use and infrastructure.
“We tested these separate hypotheses,” Jensen explained. “Is it humans that are influential? Is it climate, or is it habitat change? We found that humans limit range expansion overall.”

However, Jensen added that the human footprint impacts species differently. For some North American mammals, such as opossums, the human footprint has had a positive effect; instead of shifting further away, opossums have expanded their range closer to human populations.
However, for 75% of North American mammals, human impact limited the extent to which animal species could shift or expand their movement or habitat.
“Human footprint had the strongest and most consistent negative effect on range expansion,” Jensen wrote, suggesting that human-driven habitat disturbances generally limit the ability of species to respond to a changing climate.
For this reason, conservation strategies should consider the barriers created by human impact.

- Categories:


