Getting a Better View of Landslide Risk With LiDAR
In the mountains of North Carolina, landslides are no joke. Triggered by heavy rains, mountainside soils can become saturated and “unstuck.” As a result, what starts as a small landslide can quickly escalate into a huge debris flow that uproots trees and dislodges boulders, scouring everything in its path as it quickly flows downhill at speeds up to 30 mph. The cost – in both infrastructure and human lives – can be devastating.
A quick note on the terminology being used here. Landslides and debris flows are not the same. They are both considered “mass-wasting events” in that they move soil, debris, and rock downhill, but they differ in both water content and movement mechanism. Landslides move like a sled down a snowy slope, while debris flows, which contain more water, flow like a turbulent mountain stream – but with a lot more force.
Given the unpredictability of these mass-wasting events, figuring out where they may be more likely to occur seems a worthwhile project. Enter geologists Karl Wegmann, former NC State Ph.D. student Corey Scheip, and LiDAR.
LiDAR, which stands for light detection and ranging, is an instrument that allows geologists to make accurate 3D images of the earth’s surface through pulses of light.
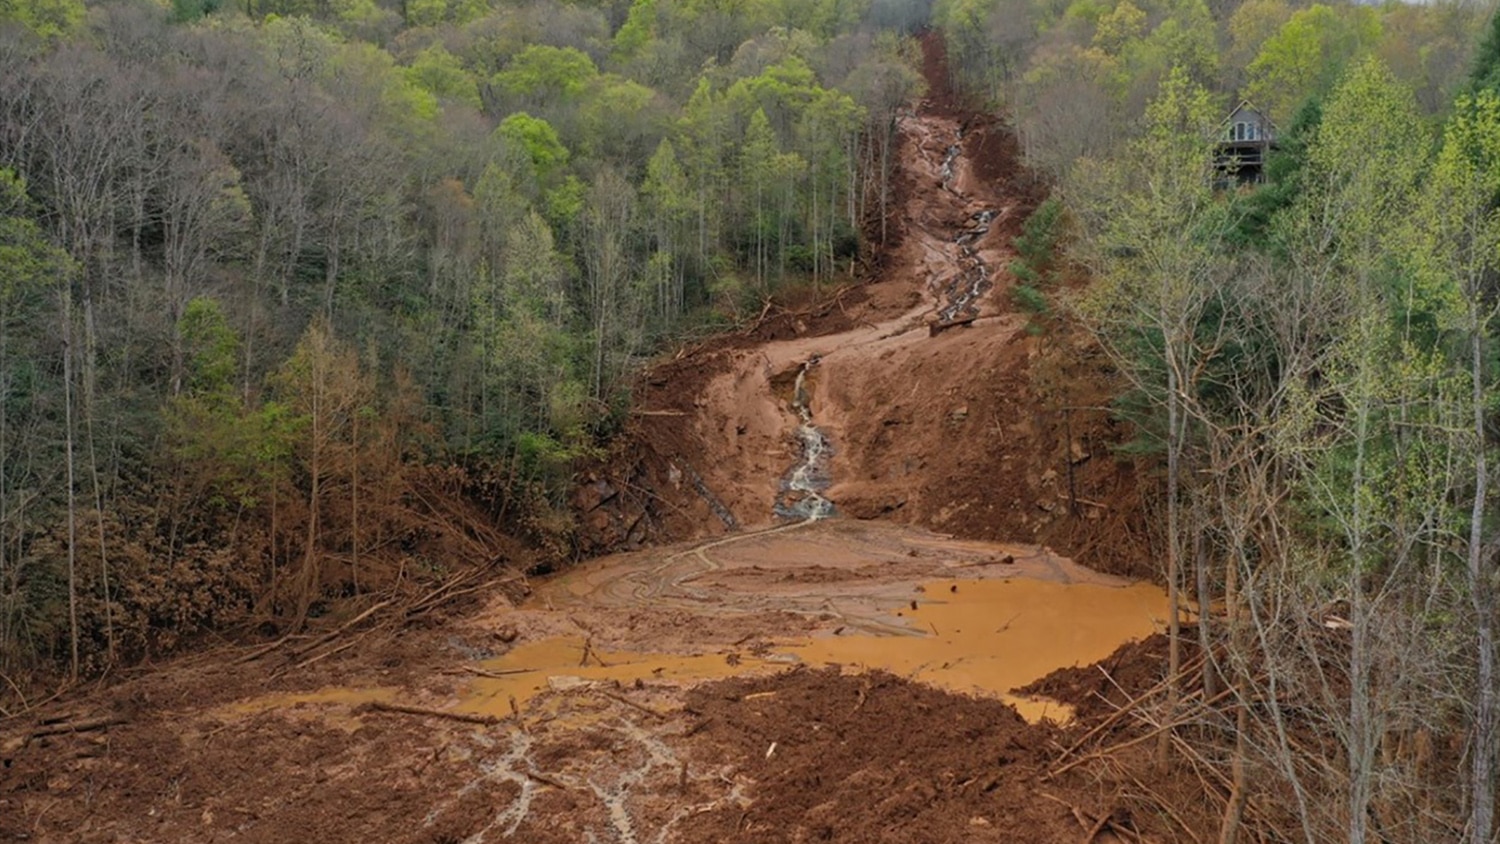
Scheip and Wegmann were studying a landslide event south of Asheville in the Blue Ridge Mountains in 2018. A storm that dumped up to six inches of rain over three hours created 240 separate landslide-debris flows in the area.
“We were fortunate because North Carolina is a leader in having the entire state surveyed with very high-resolution LiDAR topography data,” Wegmann says. “And we had LiDAR data from both before and after the event, so we were able to calculate what got displaced and how.”
Traditionally, when geologists estimate whether an area is susceptible to landslides, they study the volume of debris flow after an event and try to figure out where it started.
But LiDAR data allowed Scheip and Wegmann to look at how water flows downward from the areas above the debris flow. They then calculated how much water a certain area might receive from a storm and how likely landslides might then be in that area.
“Essentially, we calculated the contributing drainage area,” Wegmann says. “If you look at every meter of the landscape above the debris flow and estimate where water is likely to collect, you can calculate where you may get enough water to create a triggering landslide, that if it is directed into a stream channel, very likely may transition into a fast-moving and damaging debris flow event.”
The researchers also used LiDAR to look at the material transport rate along the debris flow path, meaning how much “stuff” gets moved from the start to the end of the debris flow. They found that erosion does not equal deposition, which was surprising.
“In a perfect world, a debris flow starts, flows down a track, and everything piles up at that bottom,” Wegmann says. “So, in theory, the same amount that erodes off of the hillslope deposits at the bottom. However, we found that only about 70% of the material ends up at the bottom. That means 30% is moved into a river and washed out of the system.”
Knowing how much material is actually moving downslope is important for modeling and predicting how debris flows will behave: how fast they will pick up new material, how big they will get and how far they will go. This information allows geologists to predict likely runout or deposition zones.
“Most houses are built at the foot of valleys,” Wegmann says. “This data could give builders and planners the ability to look at topography and determine less hazardous places to build.”
The work appears in the March 12, 2022, issue of the journal Landslides. Readers interested in a PDF copy of the article may contact Wegmann at kwwegman@ncsu.edu.