In Life Cycle Diagrams, Small Changes Make a Big Difference
For Immediate Release
Life cycle diagrams are ubiquitous in science textbooks, and they may be due for some updates. A new study finds simple design changes in these diagrams can have a dramatic impact on the ability of undergraduate students to understand key biology concepts.
“We were shocked by the study results,” says Jennifer Landin, corresponding author of the study and an associate teaching professor of biological sciences at North Carolina State University. “Making two small adjustments had a profound impact on the ability of college students to accurately answer questions related to ecology and evolution.”
For the study, researchers enlisted 684 undergraduates. Each study participant was given one of three different life cycle diagrams and asked to answer six questions related to an organism’s evolution and the survival of its offspring.
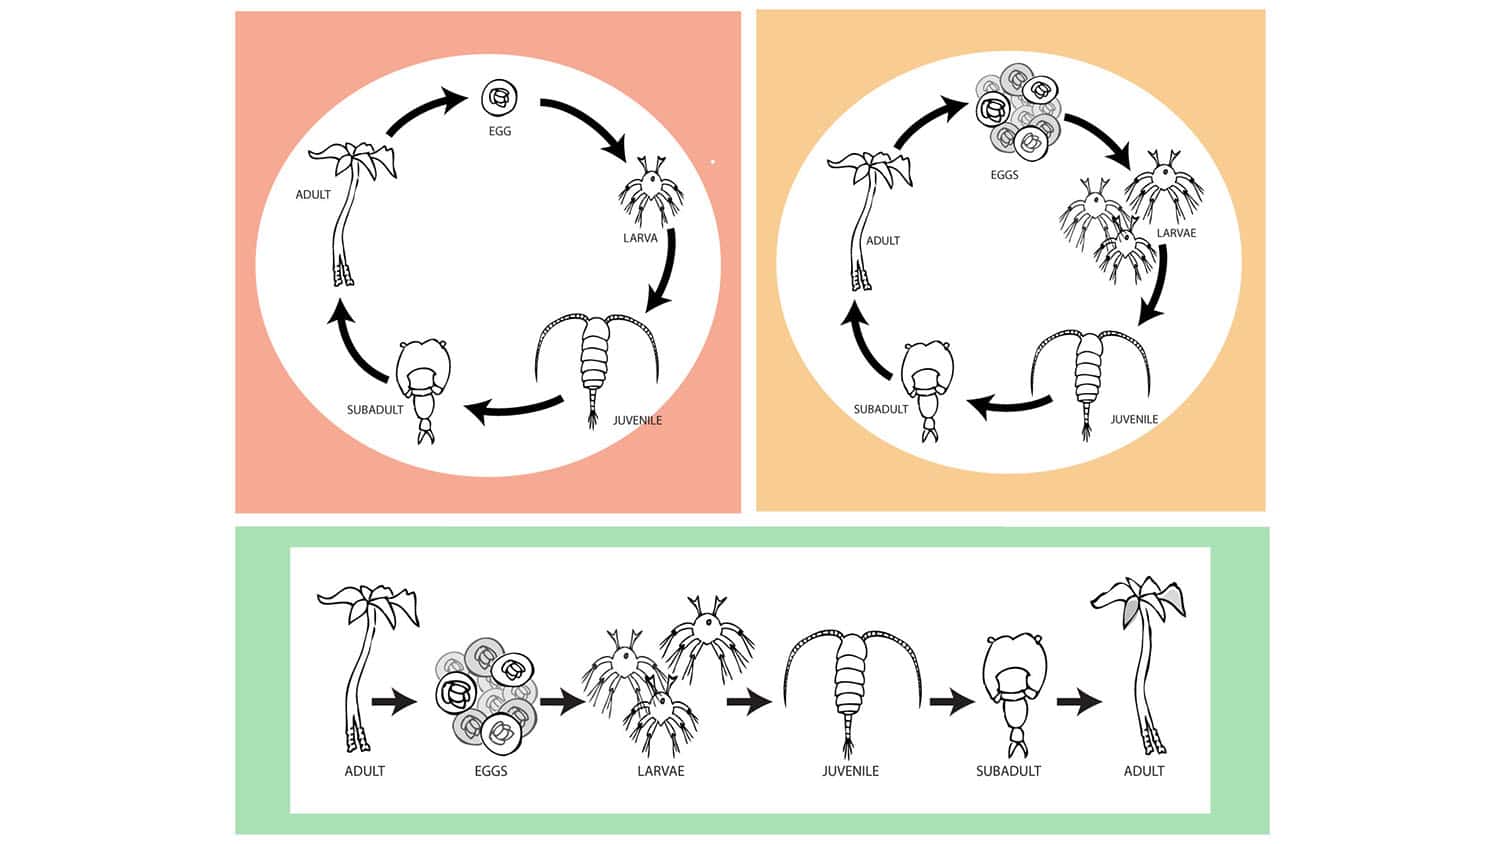
One diagram was the “traditional” format, showing the life cycle as a circle with the organism producing a single offspring. A second diagram showed the life cycle as a circle, but gave the organism multiple offspring. The third diagram gave the organism multiple offspring, but presented the life cycle in a linear format, moving from left to right.
On questions about offspring survival, the researchers found that students who were given a diagram showing multiple offspring scored 28% to 30% higher than students who had the diagram showing only a single offspring. And students who received the linear diagram scored 19% to 30% higher than the other students on questions about evolution.
Overall, students who received the linear diagram with multiple offspring earned the highest average score – answering 54.5% of the questions correctly. Students who received the traditional diagram – a cyclical layout with a single offspring – had the lowest average score. They were only able to answer 26.1% of the questions correctly.
“There are a couple of examples that underscore how powerful the effect of design can be,” Landin says. “For example, a common misconception among undergraduates is that all offspring survive to adulthood. We found that 30% of study participants who received the traditional diagram with a single offspring answered with this misconception. But only 3% to 5% of participants who received diagrams showing multiple offspring thought all of the offspring survived. That’s a meaningful difference.
“Another example is the common misconception that offspring are identical to their parents, when we know that children actually have different traits from their parents,” Landin says.
When researchers gave study participants diagrams with a cyclical format, 68% to 78% of those study participants thought offspring would have identical traits to their parents. But of the study participants who received the linear diagram, only 38% thought offspring would have identical traits to their parents.
“This is an important concept for biology students, and the format of these diagrams appears to make a big difference in helping students grasp that concept,” Landin says.
“This study suggests textbook publishers can improve student understanding of key concepts by revisiting the design of these life cycle diagrams. Furthermore, our findings suggest there may be value in studying the design elements in other life science diagrams to see if we can make them more effective teaching tools.”
The study, “Redesign of a Life Cycle Figure Improves Student Conceptions of Ecology and Evolution,” is published open access in the journal Education Sciences. The paper was co-authored by Abigail Cozart, a former undergraduate at NC State.
This work was done with support from the Provost’s Professional Experience Program at NC State.
-shipman-
Note to Editors: The study abstract follows.
“Redesign of a Life Cycle Figure Improves Student Conceptions of Ecology and Evolution”
Authors: Jennifer Landin, North Carolina State University; and Abigail Cozart, University of Colorado Anschutz
Published: April 12, Education Sciences
DOI: 10.3390/educsci14040403
Abstract: Life cycle diagrams communicate the developmental life stages of an organism. Design choices may inadvertently communicate additional information about survivorship rates, genetic variation, and microevolutionary change. In this controlled experiment, we randomly assigned one of three life cycle diagrams to 684 college students. Each figure included identical life stages of a fictitious organism’s development but differed in 1) number of offspring (single or multiple) and 2) layout (cyclical or linear). Each participant could reference the figure when answering questions about organism survival, variation among offspring, and variation between generations. Students scored 28–30% higher on questions about survivorship when the available diagram included multiple offspring. Students scored 19–30% higher on questions about microevolution when the diagram layout was linear. Overall, students who received the figure with a linear layout and multiple offspring earned the highest average score (54.5%, or 3.3 of 6 questions) on the assessment, while students with the traditional figure (cyclical layout with single offspring) scored the lowest average (26.1%, or 1.6 of 6 questions). These results suggest that figure design affects student interpretations and may assist student learning about ecology and evolution concepts and common misconceptions.